SHARK audio frontend
Decoupling sample-rate from sequence length
Julian C. Schäfer-Zimmermann
Max Planck Institute of Animal Behavior
Department for the Ecology of Animal Societies
Communication and Collective Movement (CoCoMo) Group

Bioacoustics spans frequency scales
The frequency band of interest changes across taxa—and across questions.
Nyquist limit fs / 2 Ideal upper boundary
Raw mono, 16-bit PCM 1× the data at 16 kHz
Speech: the G.722 passband is below Nyquist.
A speech-processing convention; other speech applications use wider bands.
Preserve the frequencies the question needs.
Higher sample rates increase raw data for every recorded second.
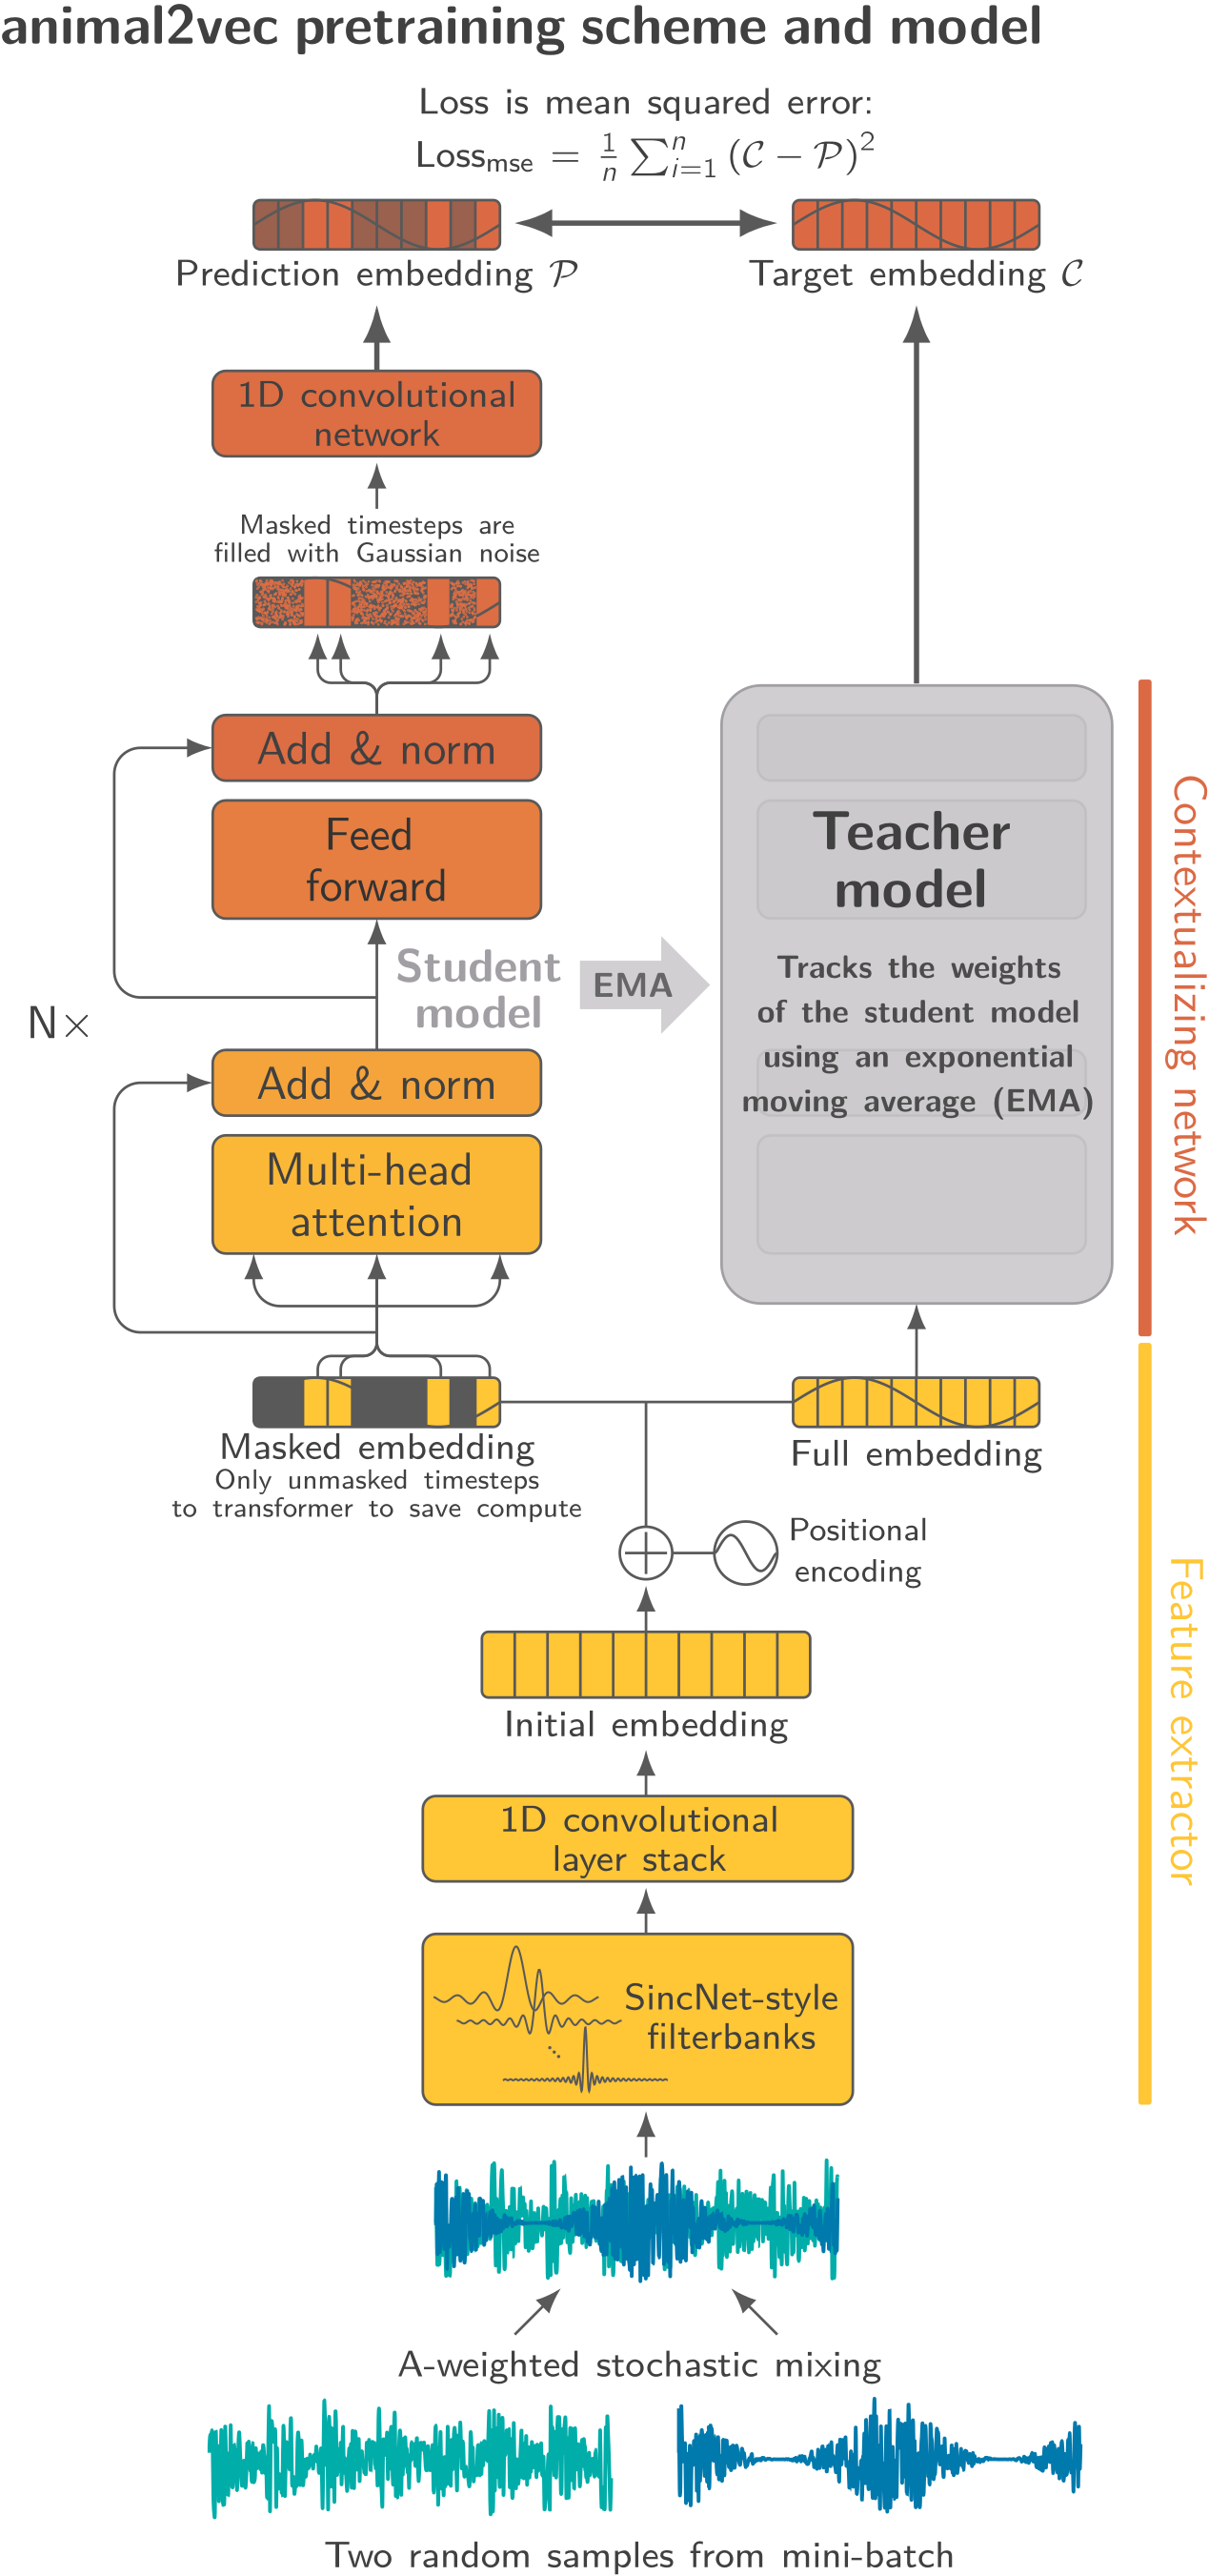
animal2vec
Learning useful representations from large amounts of bioacoustic data.
Raw audioThe recorded waveform
→
FrontendExtracts short, local acoustic features
→
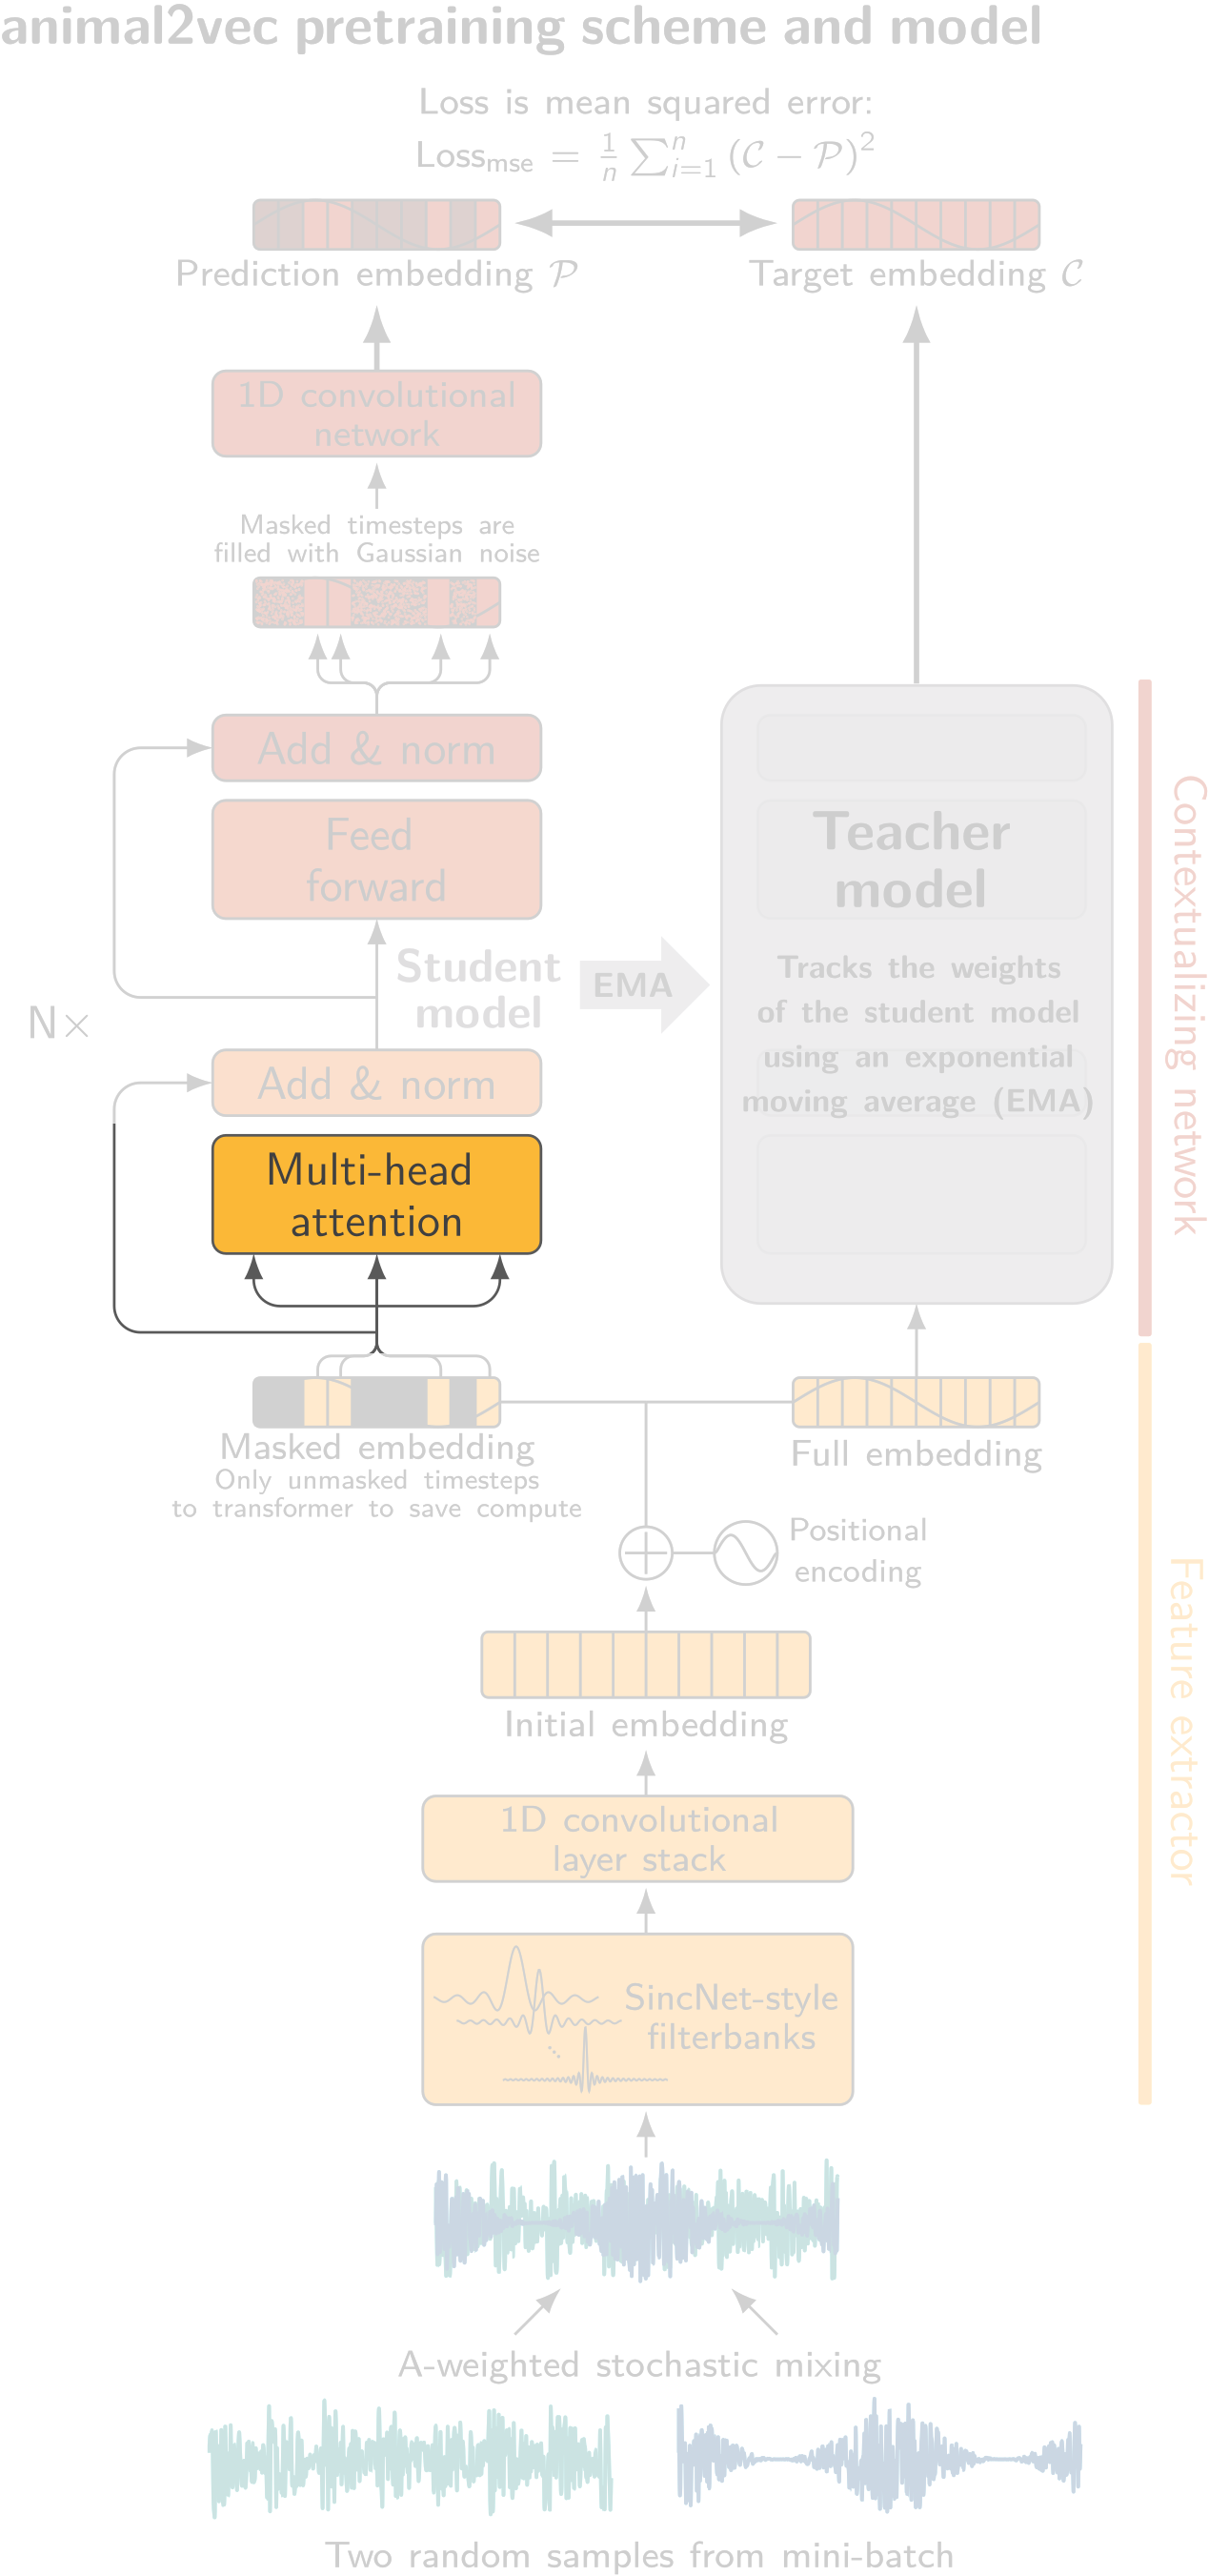
Transformer
Self-attention blocksMain contextual
feature extraction
→
Task headDetects and classifies calls
Pretrain: predict masked representations from the surrounding audio.
Fine-tune: use annotations to learn the task.
The frontend determines how much work
reaches the self-attention blocks.
Schäfer-Zimmermann et al., Methods Ecol. Evol. (2026). doi:10.1111/2041-210x.70218
Quadratic Complexity in Attention: $O(N^2)$
Sample Rate vs. Sequence Length
Illustration for a frontend with a fixed stride in samples.
12 kHz
Sequence Token Count ($N$): 6
Attention Matrix ($N^2$): 36
Example
$\text{N} = 3 \cdot 96,000 = 288,000$
Example
$\text{N} = 3 \cdot 4,000 = 12,000$
A reduction of $576$ in attention matrix size
Heterodyning
Some math ... sorry
Heterodyning
Assuming two signals:
\[ S_1(t) = A_1 \cos(\omega_1 t) \]
\[ S_2(t) = A_2 \cos(\omega_2 t) \]
\( S_1(t)\) is the signal we want to downshift
\( S_2(t)\) is the signal we use for downshifting \( S_1(t)\)
Heterodyning
Heterodyning is defined as the mathematical product of these two time-domain signals:
\[ S_{\text{out}}(t) = S_1(t) \cdot S_2(t) \]
Substituting the signal functions:
\[ S_{\text{out}}(t) = A_1 A_2 \cos(\omega_1 t) \cos(\omega_2 t) \]
Heterodyning
To resolve the frequency components, apply the trigonometric product-to-sum identity:
\[ \cos(\alpha) \cos(\beta) = \frac{1}{2} \left[ \cos(\alpha - \beta) + \cos(\alpha + \beta) \right] \]
Substituting $\alpha = \omega_1 t$ and $\beta = \omega_2 t$.
Heterodyning
Expanding the terms maps the output into two distinct frequencies:
\[ S_{\text{out}}(t) = \frac{A_1 A_2}{2} \left[ \cos\left( (\omega_1 - \omega_2)t\right) + \cos\left( (\omega_1 + \omega_2)t \right) \right] \]
Heterodyning
The system maps the original frequencies to two new spectral coordinates:
- Difference Frequency (Intermediate Frequency / IF): \[ \omega_{\text{IF}} = |\omega_1 - \omega_2| \] Utilized for down-conversion workflows.
- Sum Frequency (Up-conversion): \[ \omega_{\text{sum}} = \omega_1 + \omega_2 \] Typically eliminated via lowpass or bandpass filtering.
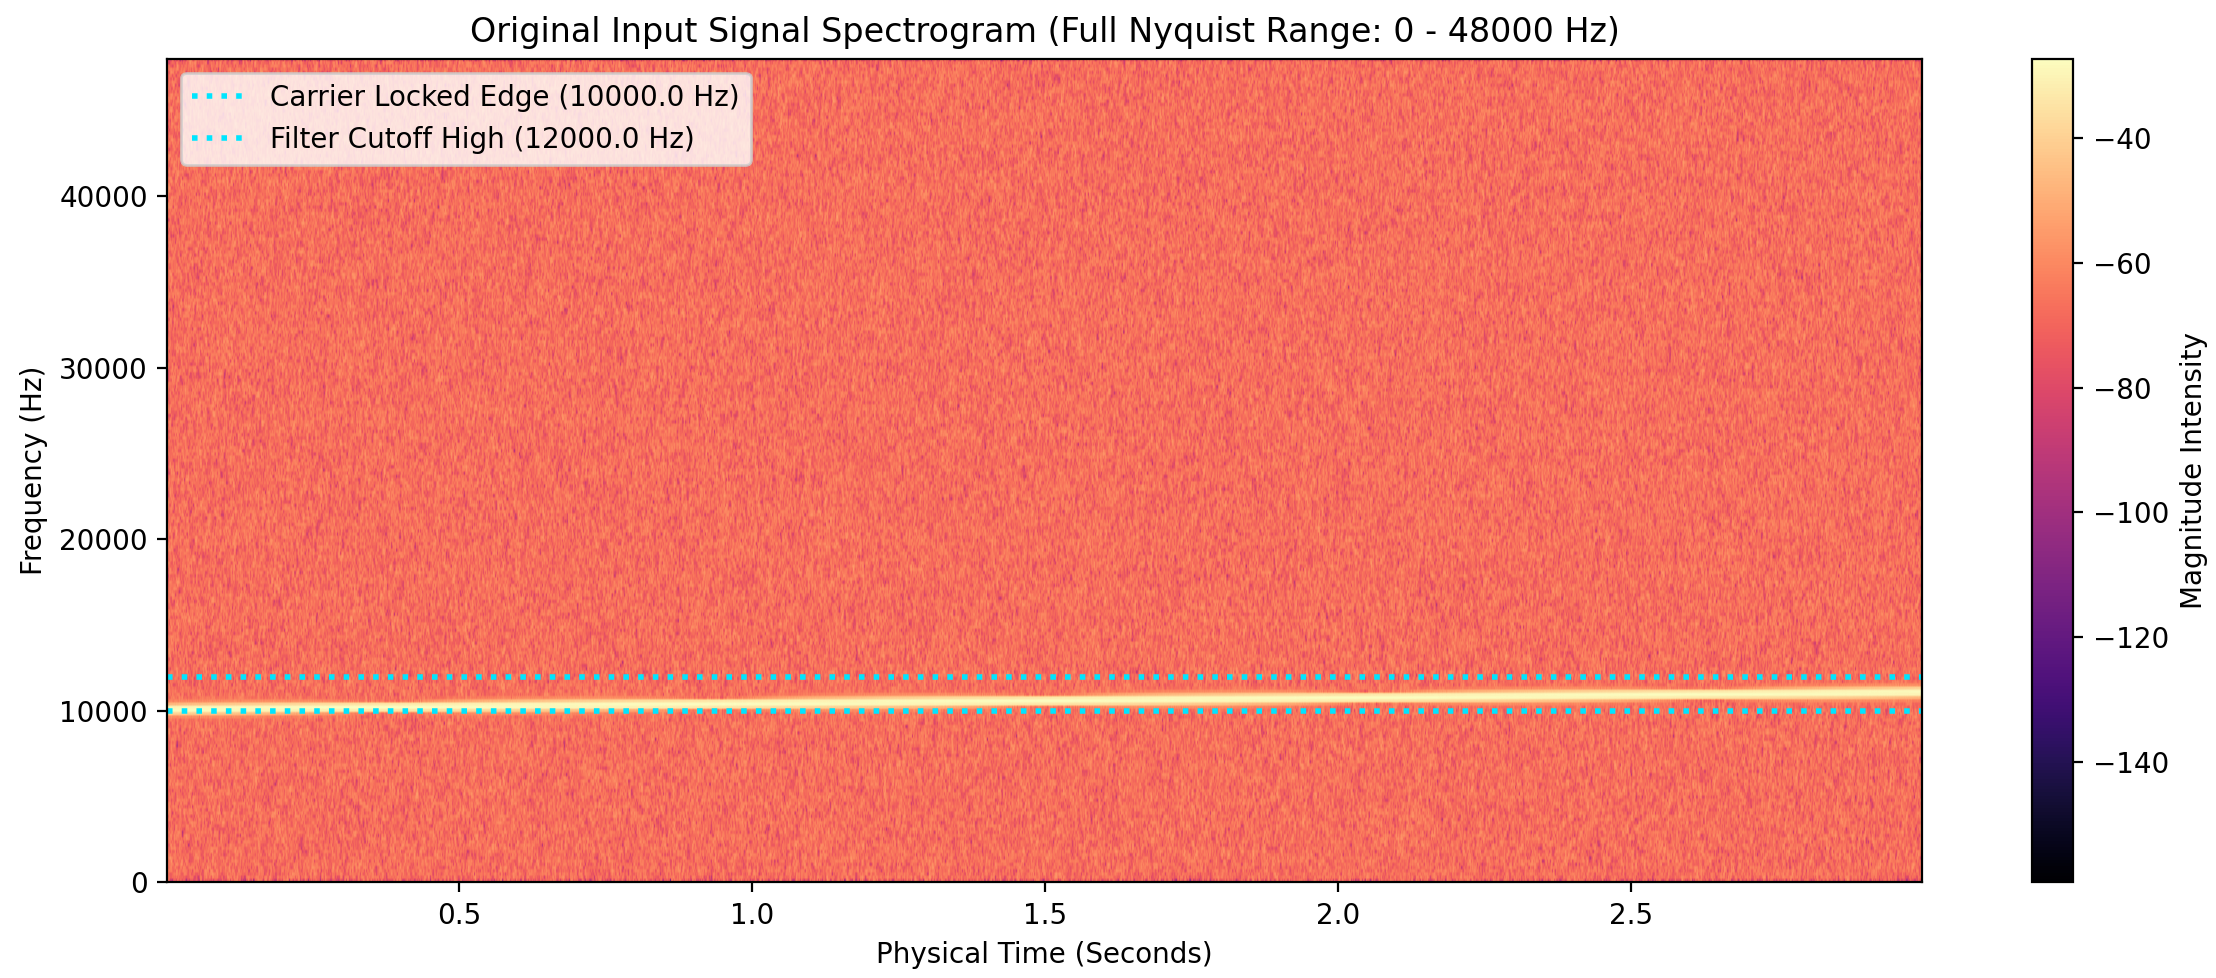
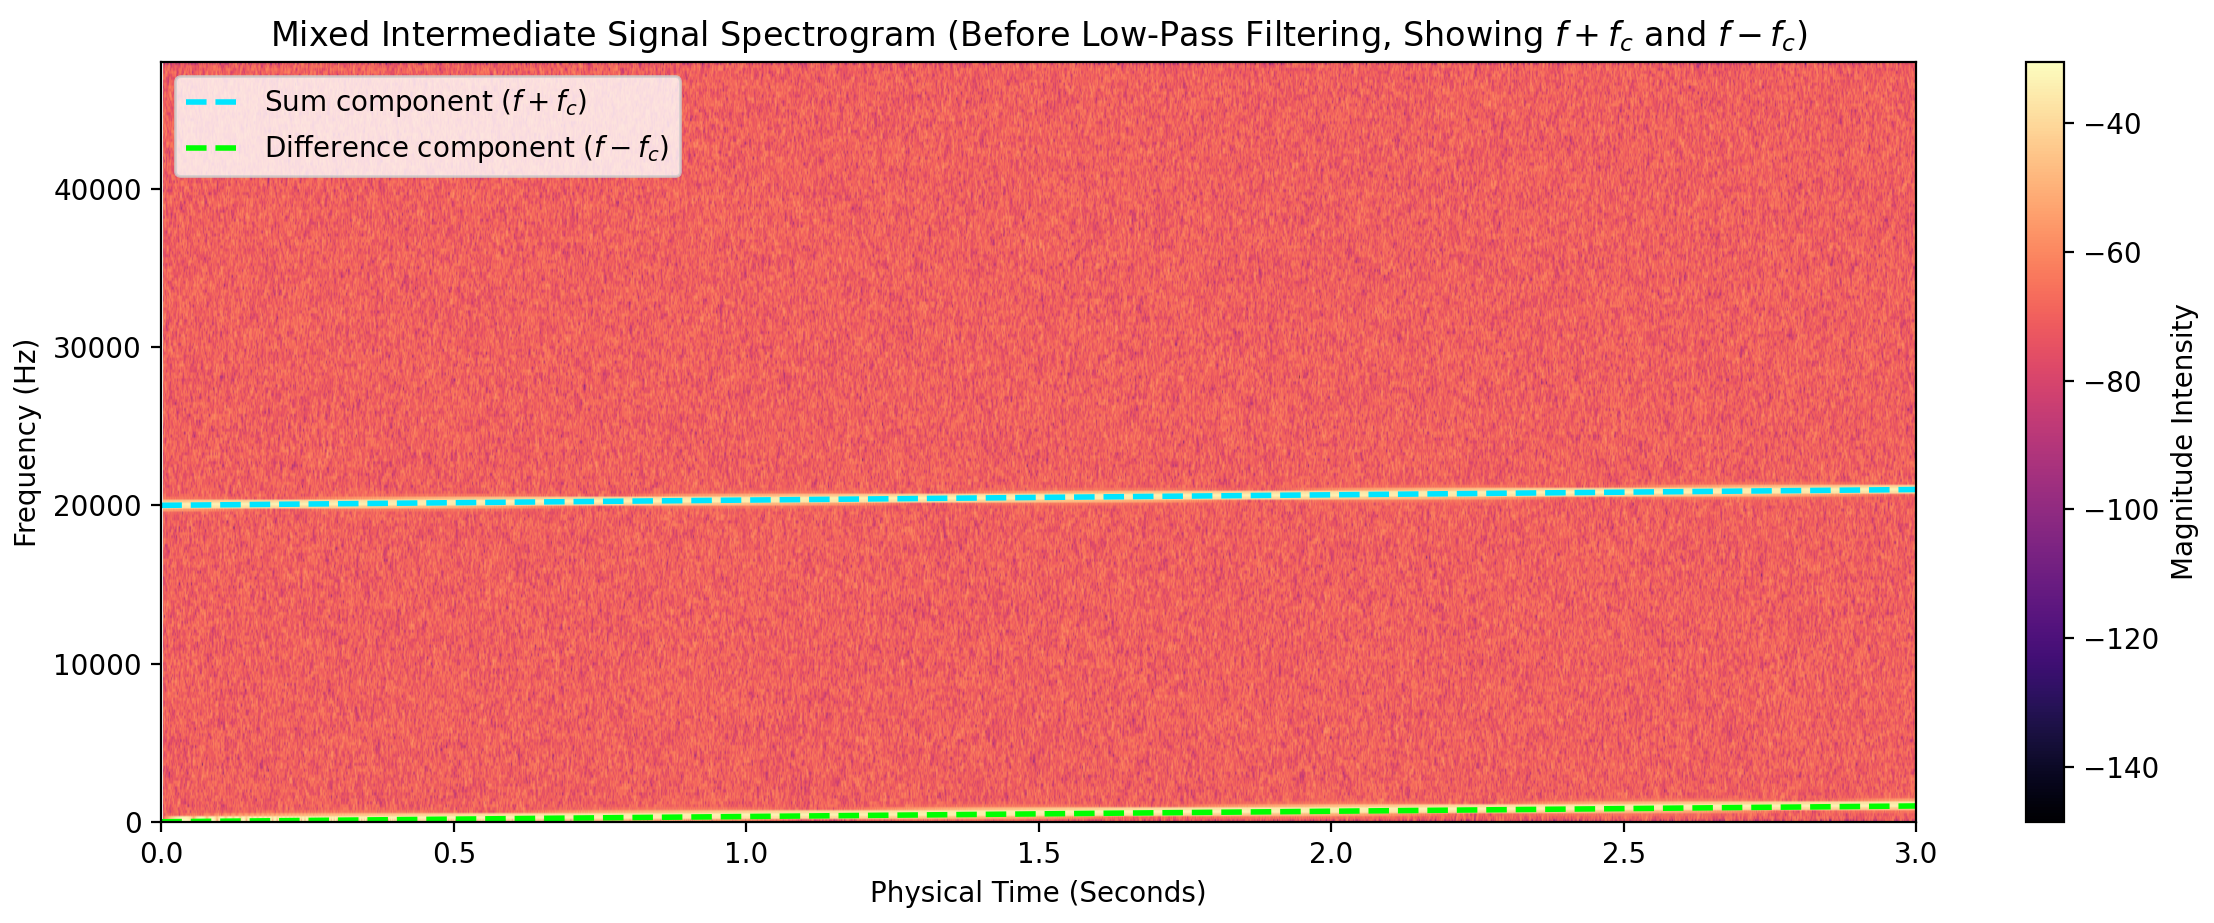
Example
We multiply by a 10 kHz signal to shift the frequency band
Example
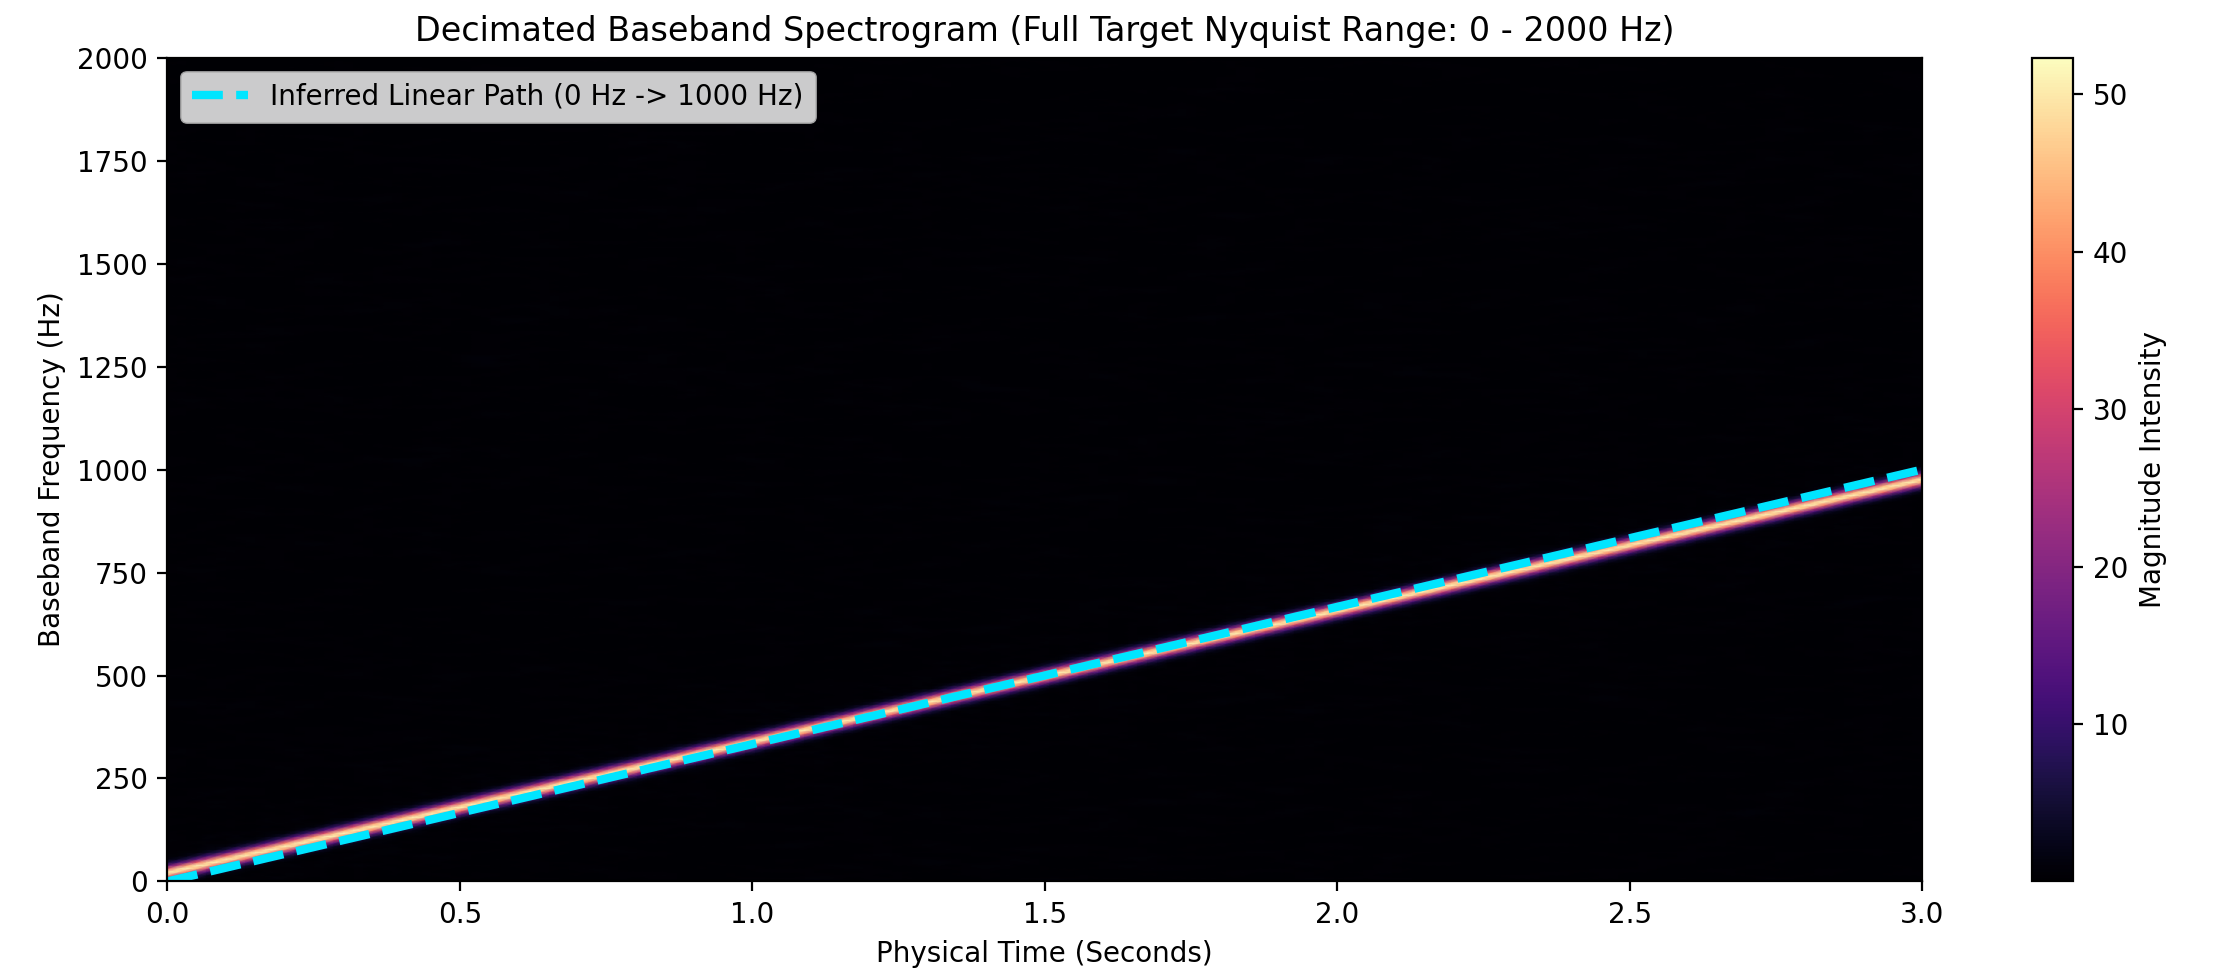
Up- and downshifted components $\Rightarrow$ Low-pass filter, then downsample
Example
Only the low-pass-filtered, downshifted component remains
The SHARK frontend
Turn each frequency band into
a slowly varying amplitude signal.
1Choose bands
Use the same physical frequency map.
2Shift down
Heterodyne each band to baseband.
3Follow amplitude
Filter and extract the band envelope.
4Share a clock
Anti-alias filter, then sample at 250 Hz.
8 kHz input 48 kHz input 192 kHz input Equal duration, equal time axis. Band counts are schematic. Fixed operations, no learned weights.
Higher input rates add valid frequency bands.
The temporal grid stays fixed.
PteroSet: three controlled conditions
The same bird recordings and labels, three audio variants.
| Shared 48 kHz192 kHz → 48 kHz | Standard performance
Can SHARK compete when every recording has the same rate? |
| Upsampled 48–192 kHz48 kHz → higher stored rates | Redundant sampling
Does performance change when we add sample points without adding acoustic information? |
| Mixed 8–192 kHz192 kHz → varying target rates | Changing rate and bandwidth
Can one frontend handle recordings with different available frequency content? |
Fixed data variants. Same ~2M-parameter Transformer for every frontend.
Binary vocalization detection in 5-second examples.
Separate redundant sampling from changes in bandwidth.
PteroSet: Ruiz et al. (2026).
PteroSet: highest AP in all three conditions
Average precision (AP). Higher is better.
| Frontend | Shared
48 kHz | Upsampled
48–192 kHz | Mixed
8–192 kHz |
| 1-second prediction windows |
|---|
| SHARK minimal | 0.826 | 0.788 | 0.795 |
| log-Mel | 0.673 | 0.419 | 0.537 |
| LEAF | 0.624 | 0.646 | 0.630 |
| Conv1D | 0.619 | 0.587 | 0.595 |
| Frame predictions on a shared 1-ms evaluation grid |
|---|
| SHARK minimal | 0.585 | 0.525 | 0.561 |
| log-Mel | 0.377 | 0.175 | 0.295 |
| LEAF | 0.429 | 0.412 | 0.265 |
| Conv1D | 0.381 | 0.319 | 0.295 |
MAP1 validation. Shared ~2M backbone. The 1-ms grid interpolates predictions.
SHARK minimal leads on both readouts.
Mixed rates across animal datasets
Can one model learn from recordings spanning
8–250 kHz and very different acoustic environments?
MeerKAT8 kHzMeerkats
HyenaSET24 kHzHyenas
PteroSet48 kHzBirds
Neotropical
katydids96 kHzInsects
Egyptian
fruit bats250 kHzBats
One task: detect animal vocalizations over time.
45.3 hours in total. Corpus-specific input rates. Shared ~125M Transformer.
Compare all frontends, including SHARK minimal and enhanced.
A test of joint learning across heterogeneous recordings.
Rate, taxon and recording conditions vary together.
PteroSet uses its prepared 48-kHz variant.
Mixed rates: enhanced SHARK leads overall
Frame-level average precision (AP). Higher is better.
| Dataset | SHARK
minimal | SHARK
enhanced | log-Mel | LEAF | Conv1D |
| Micro AP | 0.404 | 0.779 | 0.564 | 0.253 | 0.199 |
| Macro AP | 0.274 | 0.629 | 0.435 | 0.256 | 0.318 |
| MeerKAT | 0.553 | 0.846 | 0.310 | 0.166 | 0.240 |
| HyenaSET | 0.483 | 0.859 | 0.639 | 0.345 | 0.603 |
| PteroSet | 0.108 | 0.423 | 0.259 | 0.111 | 0.074 |
| Katydids | 0.066 | 0.118 | 0.052 | 0.058 | 0.040 |
| Fruit bats | 0.161 | 0.900 | 0.914 | 0.601 | 0.635 |
Micro: all frames pooled. Macro: mean AP across the five corpora.
+21.5 AP points micro; +19.4 macro over log-Mel.
Enhanced leads on four corpora. Log-Mel leads on fruit bats.
Shared 1-ms evaluation grid. Highlight: highest AP in each row. Absolute AP differences.
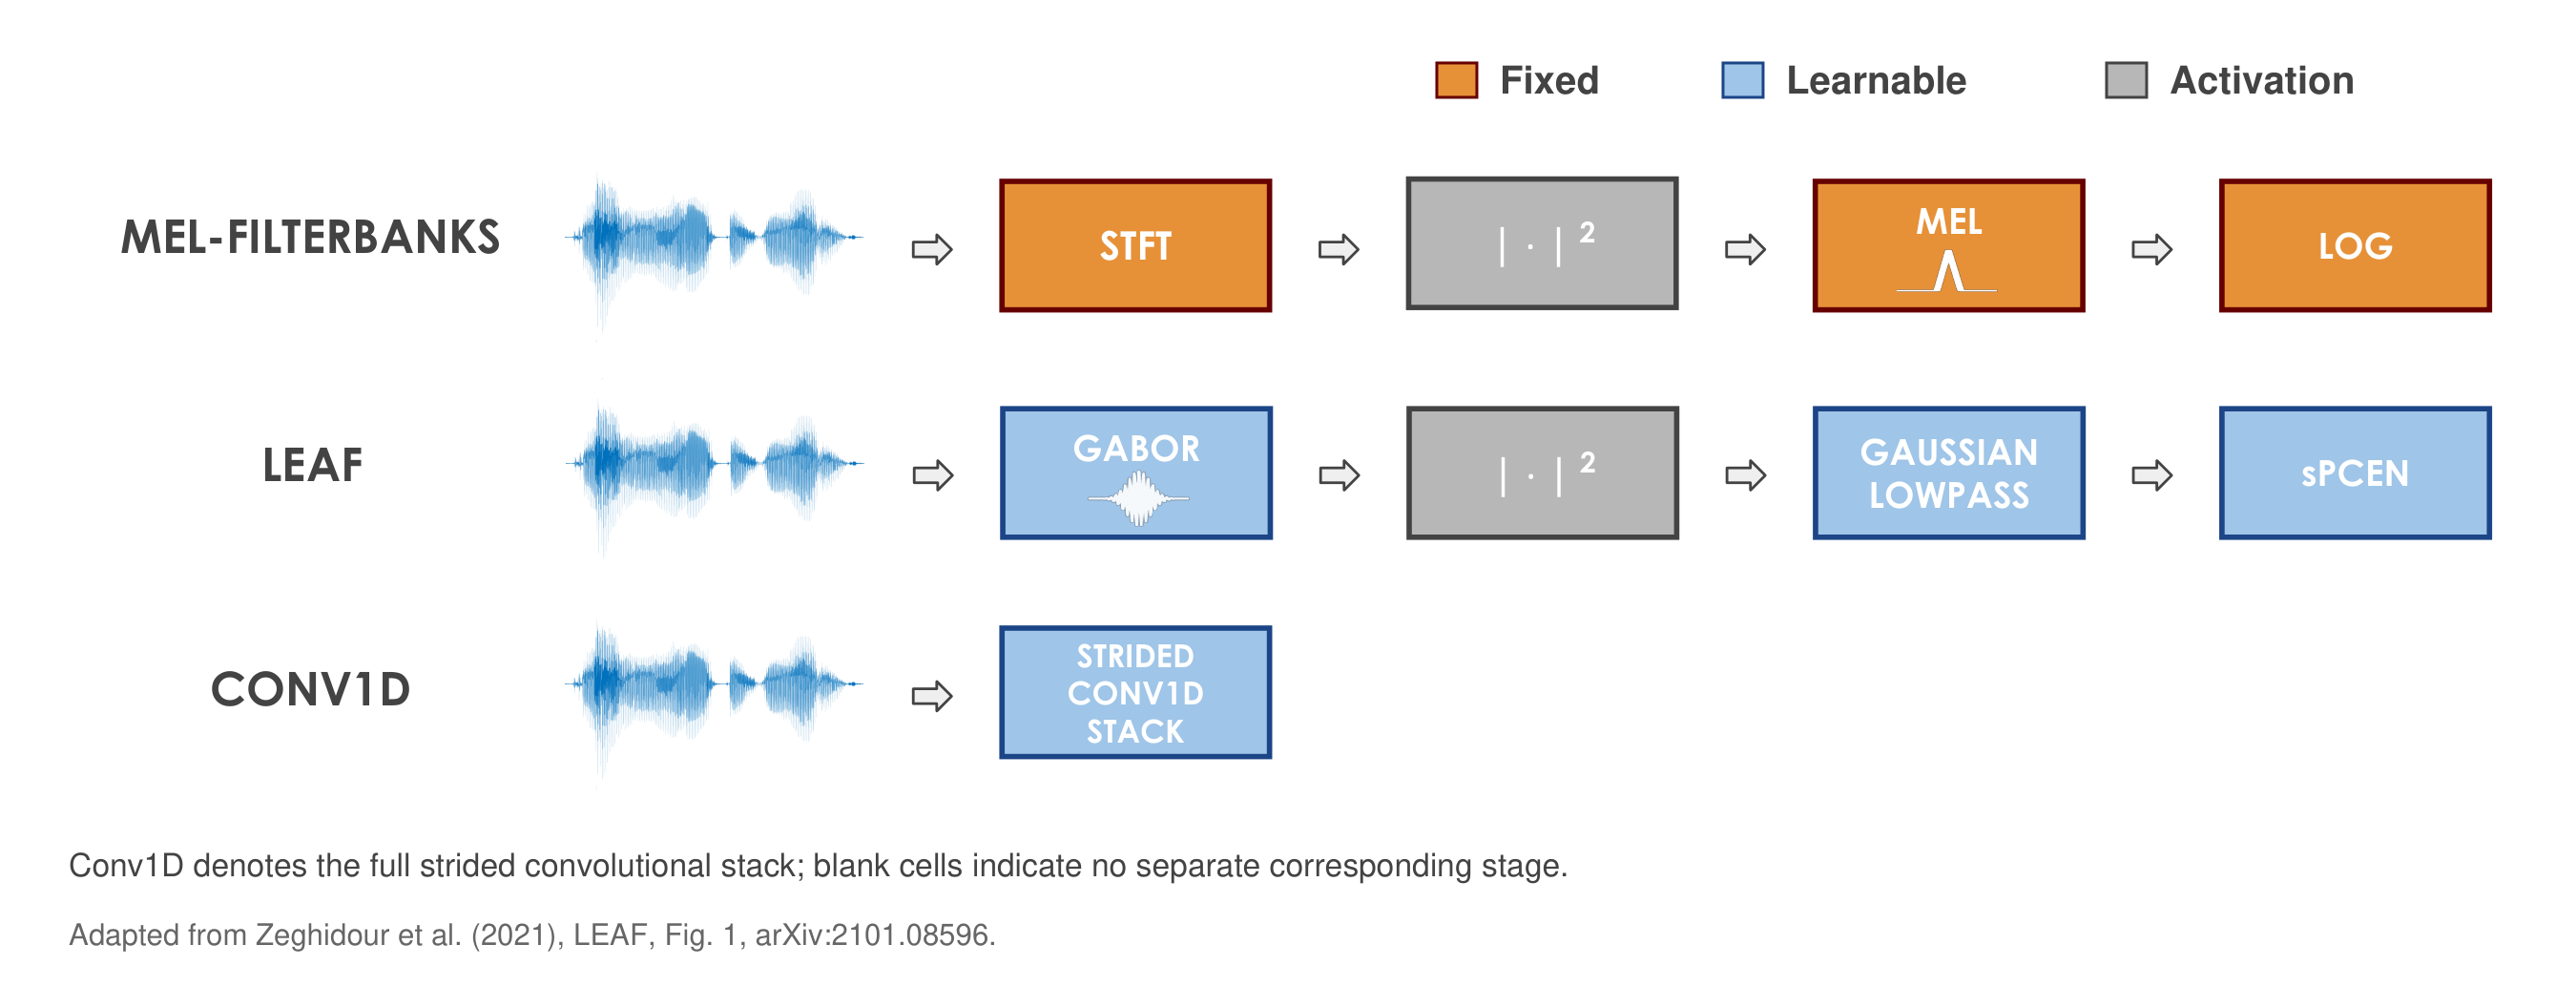
Other frontends
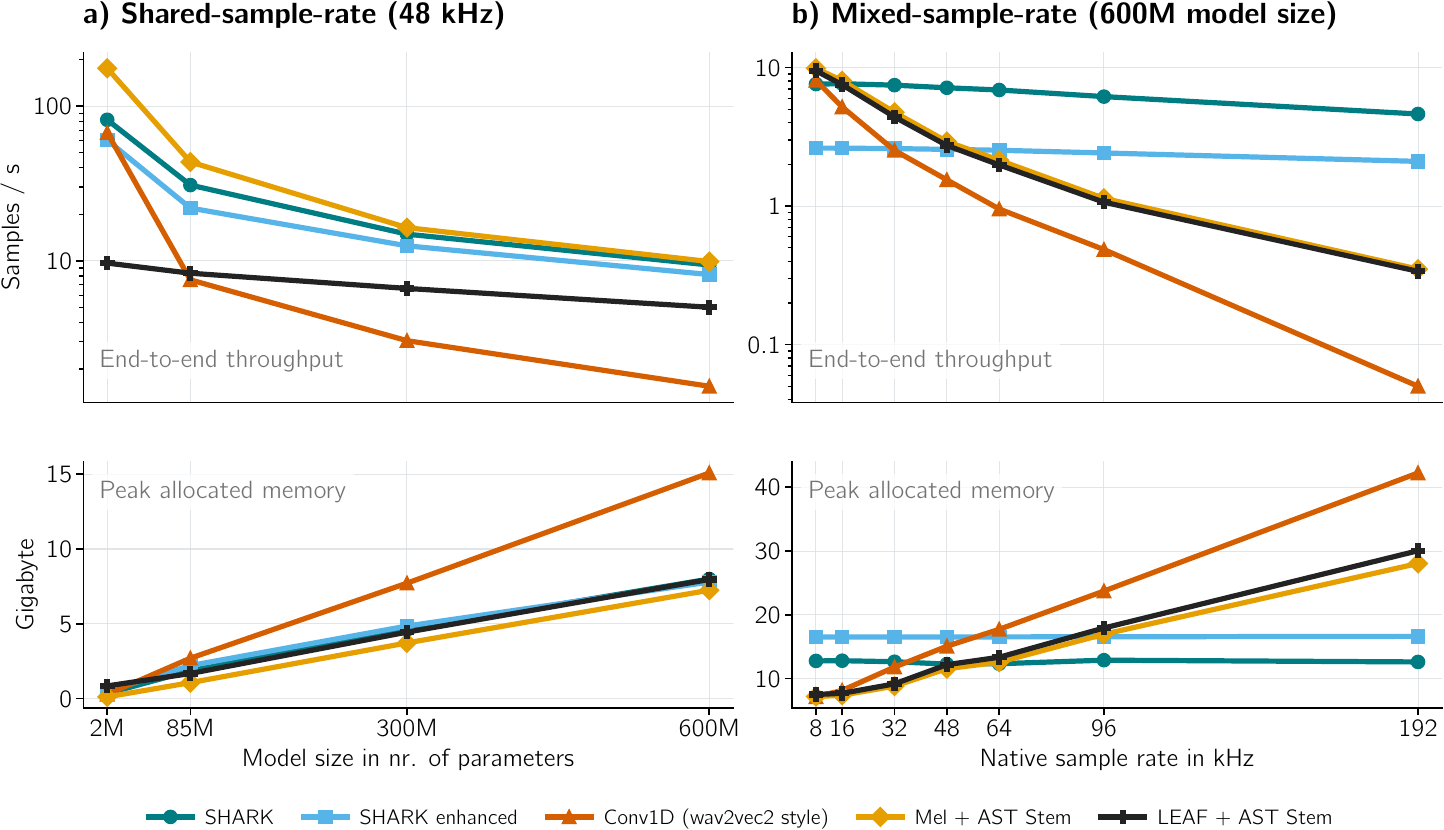
Outlook
Foundation-scale animal2vec
Pretrain on larger collections of animal audio at different sampling rates.
Use a shorter, shared time grid to make larger models and longer context more practical.
Next test: representations that transfer across taxa, environments and tasks.
An electronic frontend
The fixed signal-processing stages could run in dedicated circuitry on the sensor.
Mixing + filtering + envelopes
↓
Low-rate digitization
↓
Digital stem and model
Next: validate feature quality and measure whole-device energy use.
Make large-scale learning more practical,
and bring efficient preprocessing closer to the recording.
Acknowledgments
SHARK is a collaborative project.
 Marie A. Roch San Diego State University
 Ariana Strandburg-Peshkin Max Planck Institute of Animal Behavior
SHARK audio frontend
Decoupling sample-rate from sequence length
Julian C. Schäfer-Zimmermann
Max Planck Institute of Animal Behavior
Department for the Ecology of Animal Societies
Communication and Collective Movement (CoCoMo) Group